You ran the test. The p-value came out clean. You wrote it down. Then the exam asked, “What does this result actually tell us about the population?” and you froze. Closing that gap is what our UVic and Camosun stats tutors do best.
If that sounds familiar, you are not bad at statistics. You have just hit the exact spot where UVic and Camosun intro stats courses separate the students who can push buttons from the students who understand what the buttons did. This guide gives UVic statistics help for the real courses you are in: STAT 255 and STAT 256 (Life Sciences), STAT 252 (Business), STAT 260 (Introduction to Probability and Statistics), and the Camosun intro sequence, STAT 116 and STAT 216. By the end you will know why these courses trip people up, where the conceptual wall actually is, and how to study so the exam questions stop feeling like ambushes.
We also tutor these courses online across BC, so if you are taking them remotely, everything here still applies.
Why intro stats blindsides students from every faculty
Walk into any intro stats section and look around. Biology and nursing students in STAT 255, business students in STAT 252, psych and general-science students in STAT 260, and the whole mix in Camosun’s STAT 116 and STAT 216. Almost nobody planned to be doing serious quantitative work, and that mismatch is the whole problem.
Your advisor called this a “requirement,” not a math course. Then week three arrives and you are reasoning about sampling distributions and probability. The issue is not that the material is impossibly hard. It is that the course expects a level of conceptual thinking that feels different from anything in your major. Memorizing a process gets you through a lot of first-year courses. It does not get you through this one, because the exams test whether you understand what the numbers mean.
That is good news, actually. It means the fix is not “grind more practice problems.” The fix is learning to think about what the output represents.
The descriptive-to-inferential wall
Here is where most students stall, and it happens at a predictable point in both the UVic and Camosun sequences.
The first few weeks feel manageable. Means, medians, standard deviation, histograms, boxplots. This is descriptive statistics, and it is intuitive because you are just summarizing data you can see. Then the course pivots to inferential statistics, and suddenly you have to say something about an entire population you never measured, based on one sample you did.
That leap is the wall. It is not one formula. It is a chain of ideas that has to click together:
- Your sample is one of many possible samples you could have drawn.
- If you imagine all those possible samples, their results form a pattern called a sampling distribution.
- That pattern is what lets you reason about the population and attach a probability to being wrong.
A typical student learns to compute a confidence interval without ever internalizing that it is an interval of plausible values for the population parameter, not a statement about the sample. Same with hypothesis testing. Students learn the steps of a t-test long before they can explain that a p-value is the probability of seeing a result this extreme if the null hypothesis were true. When the exam asks for interpretation, the steps do not save you.
The tip we give every student at this stage: after every procedure, force yourself to finish the sentence “This number means that, in the real world, …” out loud. If you cannot finish it, you have found your gap.
R, SPSS, and the trap of running procedures you cannot explain
Intro stats at UVic and Camosun comes with a software component, and depending on your course and instructor that will be either R or SPSS. Camosun’s STAT 216, for example, runs its labs in R. The specific tool matters less than the trap that both create.
The trap is this: the software makes it very easy to produce output you do not understand. In R, you can copy a line of code from the lab handout, run it, and get a clean table without knowing which number is the test statistic and which is the p-value. In SPSS, you can click through the menus, land on a results pane, and have no idea which of the dozen boxes the question is actually asking about. Either way you feel productive, and either way you have learned nothing the exam will reward.
We see the same moment constantly in tutoring. A student runs a two-sample t-test perfectly, points at the correct p-value on the screen, and then cannot say whether the groups are different or what “different” even means here. The procedure is flawless. The understanding is missing. And the understanding is what earns the marks.
Two things help:
- Treat the software as a calculator, not a teacher. Before you run anything, know what question you are answering and what a “yes” or “no” answer would look like.
- After you run it, cover the code or the menu path and explain the output to someone else, or to yourself. If you can only reproduce the clicks, you have memorized the wrong thing.
How to actually study: the UVic statistics help that works
If your study routine is “redo the lab exercises until I can get the right numbers,” you are practicing the one skill the exam does not test. Flip it.
For every worked example, write two things: what you did, and what the result means in plain words. The second part is the whole game. Practice interpreting output you did not generate yourself, because that is exactly what interpretation questions do. Take a p-value, a confidence interval, or an R or SPSS printout, and translate it into a sentence a non-stats person could understand.
Do this and something shifts. The exam stops feeling like a memory test you are destined to fail and starts feeling like a set of questions you can reason your way through, even on a version of the problem you have never seen. That shift is what real UVic statistics help is aimed at, and it is also why free campus resources like the UVic Math and Stats Assistance Centre are worth using alongside focused tutoring.
Quick recap
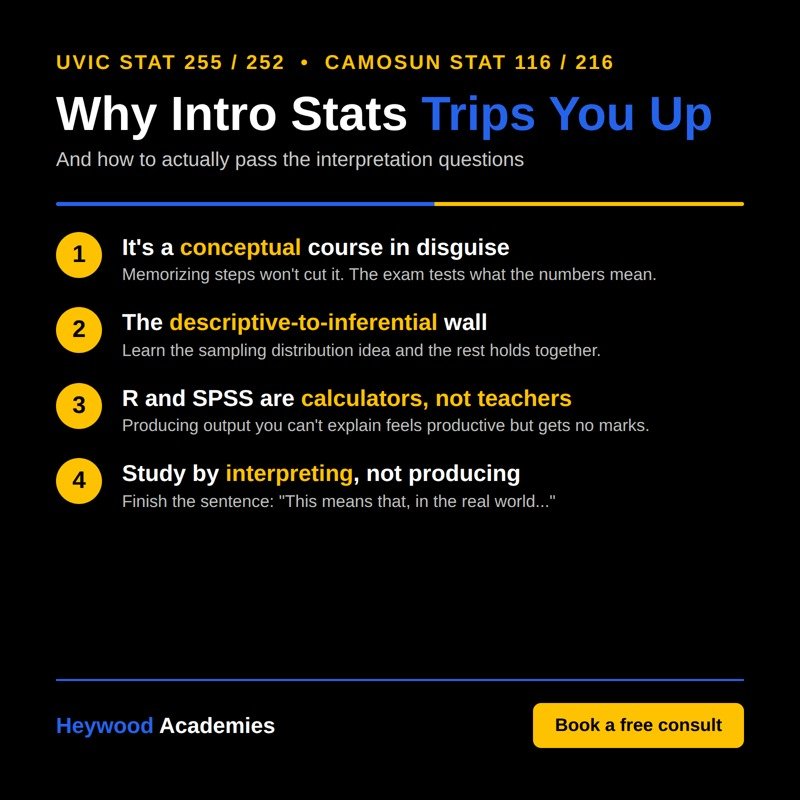
- Intro stats is a conceptual course wearing a “requirement” costume. Understanding beats memorizing.
- The descriptive-to-inferential jump is the wall. Learn the sampling distribution idea and it holds together.
- R and SPSS both let you produce output you cannot explain. Do not confuse running the procedure with understanding it.
- Study by interpreting output, not just producing it. Finish the sentence “This means that, in the real world, …”
Get unstuck before the midterm
If the descriptive-to-inferential wall or the R and SPSS output is where you keep getting stuck, that is exactly the kind of thing a focused session sorts out fast. The UVic statistics help we offer covers STAT 255, STAT 252, STAT 260, and Camosun’s STAT 116 and STAT 216, in Greater Victoria and online anywhere in BC. Book a free consult and we will figure out where your gap actually is.